
US Sourcing in 2023-Q1
The US import for major consumer products* valued US$94.5B, down by -5.3% compared to 2022-Q4, and a deeper dive at a rate of -13.0% the same period in prior year. The drop is partly due to the seasonality that Q1 and Q2 are usually the recess period of the country’s imports – be it pre- or post-pandemic impact. Partly the domino effect resulted from retail overstock.
consumer products*: Limited range of 20 categories from 5 product lines.
Soft Goods*: Apparel, Accessories & Footwear
Electrical Product - Driving Growth, Safety & Performance Testing Prevent Burn and Fire Risk
US Retailers at large struggled with slow stock in the last quarter as the high inflation rate at the end of December 2022 critically weakened consumers’ consumption power and so their spending priorities focused more on essentials and utilities than consumption products.
US Import | 18Q1 / 23Q1 Comparison
Impost Share(%) by Product Line
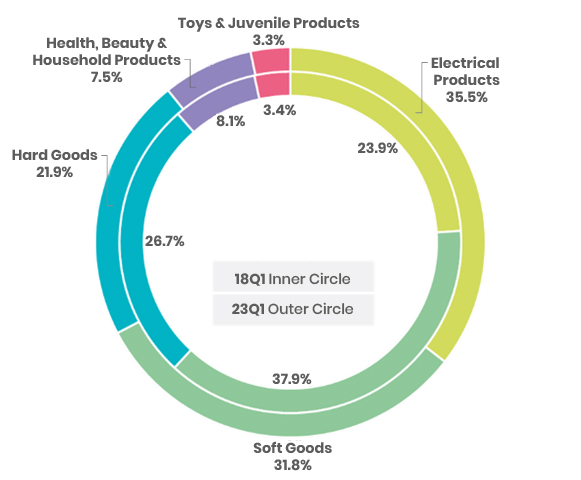
Although overall consumer product imports grew at a CAGR of +3.7% between 18Q1 and 23Q1, mainly driven by electrical products. The product sector registered growth at a CAGR of 12.2% over the last 5 years. Energy Storage, HVAC and Large Appliances are on the top sourcing list.
However, based on the USCPS’ report, electrical products captured about 19.4% of total consumer products being recalled among all recalled cases in the consumer products sector between FY21 and 23Q1. The cases involved at least 14M units and almost all are recalled due to burn and fire hazards. Hence, special attention and safety and performance testing and inspection throughout the supply chain is critical if you are to source, consider expanding your merchandise scope, or even develop your private label.
Diverse and Nearshoring Supply Chain for Fashion Products Sourcing More Obvious, Transparency in Supply Chain Critical to Seamless Transition
After years of struggling with increasing shipping costs led by geo-political tension among nations, various global affairs, signs have shown that US importers are now making move sourcing Fashion Products (Apparel, Accessories and Footwear) from China alternatives. For example:
Fashion Products Import Share Changes in Percentage Point
(22Q1 vs. 23Q1)
|
Soft Goods Categories |
Key Market Losers |
Key Market Winners |
|---|---|---|
| Apparel | Vietnam (-1.5) China (-3.4%) |
Bangladesh, India, Indonesia Mexico, Honduras, Nicaragua Italy |
| Footwear Products | China (-7.2%) | Vietnam, Indonesia Mexico Italy, Germany, Spain |
| Accessories | China (-6.6%) | Vietnam, Bangladesh, Sri Lanka Italy, France Mexico |
Although Vietnam and China ranked in the Top 2 of US imports for Apparel in 23Q1, their share dropped and shared by partners in the Top 10. Bangladesh, India, Indonesia in the SA/SEA region; also, Mexico, Honduras, Nicaragua in South America, as well as Italy in Europe all registered positive growth in percentage points YoY (22Q1 vs. 23Q1).
For Footwear Products, China remains the top of US import share for the category; however, its import share dropped by -7.2 percentage points YoY (22Q1 vs. 23Q1), and the sum was split by Vietnam, Italy, Indonesia, Mexico, Germany, and Spain.
For Accessories, again, China stays at the top of the import list. Among the Top 10 trade partners, which accounted for ~85% of imports in the category, China's share diminished by 6.6 percentage points YoY. Italy, Vietnam, France, Bangladesh, Mexico and Sri Lanka, on the other hand, are partners with growth in share amongst the Top 10 queue.
As long as the bilateral tension and the shipping cost inflation unresolved, the emerging force of the supply chain will remain if not continue growing bigger into new power. Even though, under current economic uncertainty, saving capital cost is the priority focus for US-based sourcing agencies and importers, never forgone the invaluable expenditures such as environmental, social and ethical costs, as well as product quality that consume for the making of finished products. Especially when Sustainability is set as a global target and Green Guides for Environmental Marketing Claims is soon to become mandatory. As such, supply chain transparency is critical that empowers you—as a brand, retailer, or sourcing agency—to monitor in clarity the status of your suppliers at all Tier levels performing along your ESG strategy and goals, and act and correct in advance before any misconduct emerges as a risk.
GREEN GUIDES – A TOKEN OF RISK OR CHANCE?
HOW DOES THE MARKET REACT TO SUSTAINABLE PRODUCTS?
“Consumers are in fact buying sustainable goods…with price premium ranging from 16-35%”
McKinsey and NielsenIQ Research, May 2023
"Consumers care about sustainability—and back it up with their wallets… Products making ESG-related claims averaged 28% cumulative growth over the past five-year period, versus 20% for products that made no such claims.”
McKinsey and NielsenIQ Research, Feb 2023
What is Green Guides?
According to the Federal Trade Commission, the Green Guides are designed to help marketers avoid making environmental claims that mislead consumers. Although the guides are not yet mandatory rules or regulations, the FTC can take corrective action when conduct misalign with the guides. Those who fail to comply could result in a civil penalty of up to $50,120 per violation. In fact, according to FTC news, at least 5.5M worth of penalty FTC charged due to misleading claims in 2022.
From the result found from the consumer survey co-conducted by McKinsey and NielsenIQ, we realise that GREEN CLAIMS do make money. However, is Green Guides here to purely curbing you using it to make profit? Very likely not, the Green Guides here is not just to help shortlist who is simply “GREENWASHING,” but also affirms trustworthy GREEN CLAIMS. Under Green Guides, any product bears a highly recognized TRUST MARK or CERTIFICATION MARK, that is accessible, visible and traceable, is consider as a recognition of your effort to make sustainability possible. In return, you will be rewarded with consumer loyalty and retain their spending on your brand products and merchandises that help your business growth.
Interested in knowing more about ways to flip over risk into chance for your business and brand?
Register for our 2nd Sustainability & Supply Chain Solutions Summit Series at which we will share practical insights on how our supply chain solution can be flexibly applied to real business cases across the consumer products industry.