Global Footwear Trade Flow 2020 Report - Global & US Market
Welcome to our Global Footwear Trade Flow 2020 Report (Part 1 of 2) - Last updated in November 2020.
In this report, we will be covering both Global and US market trade flow analysis for the footwear industry. Hope you enjoy our report and please feel free to use the contact us form at the bottom of this page to speak with our representative if you have any questions.
Data Source: Trademap.org
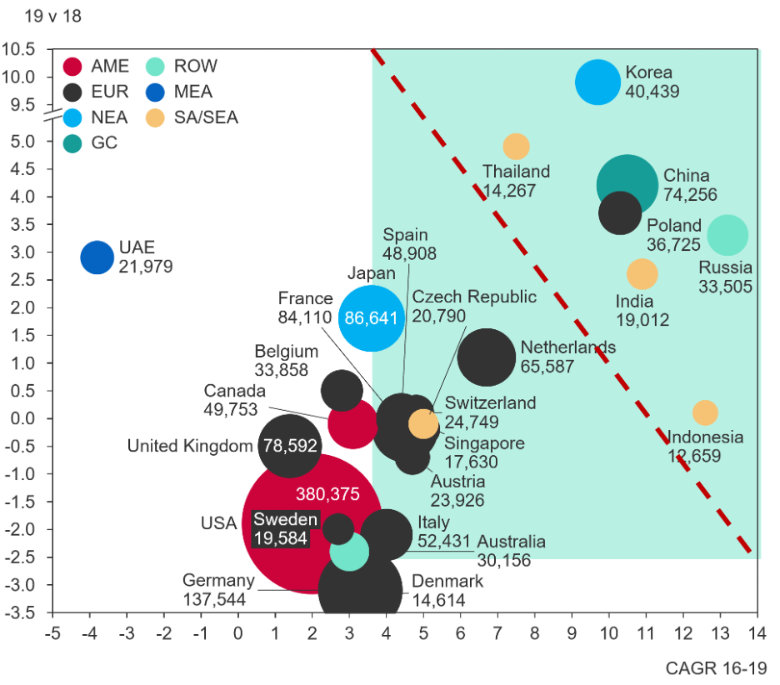
The leading country importer of consumer goods (softlines, hard goods, toys and consumer electrical and electronics) remains the USA with over 1/5 of all global imports destined for USA, however, its relative weight is declining year on year dropping from over 24% in 2016 to under 23% in 2019.
Germany, Japan, France and the UK round out the top 5, with only France demonstrating a +0.1% relative share gain.
The next four biggest growth importers of consumer goods in terms of relative weight include France, the Netherlands and Poland in Europe; China, Korea, Indonesia and India in Asia as well Russia.
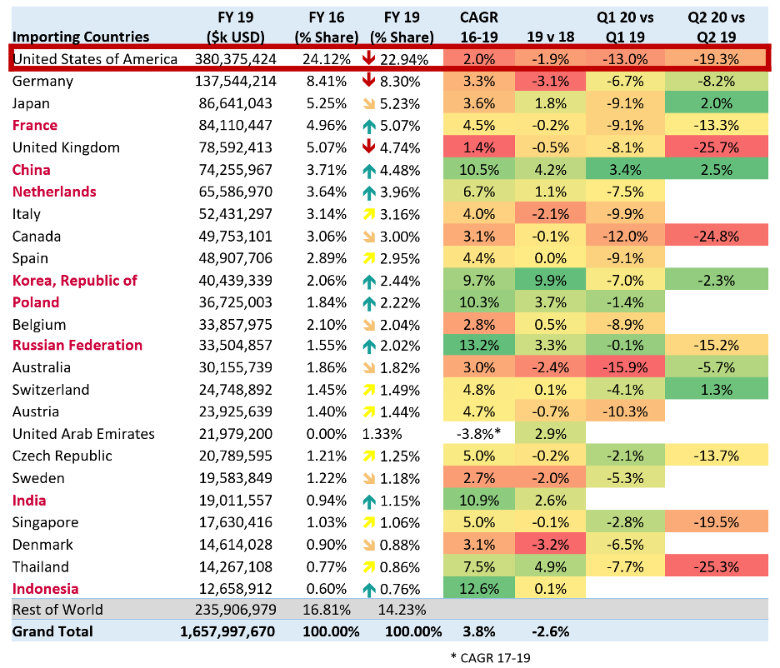
When looking at the bubble chart, the star growth countries can be seen in the upper right quadrant – namely, Korea, China, Russia, Poland, Thailand, India and Indonesia, who all maintained above average growth rates in 19 vs 18 as well 16-19 CAGR.
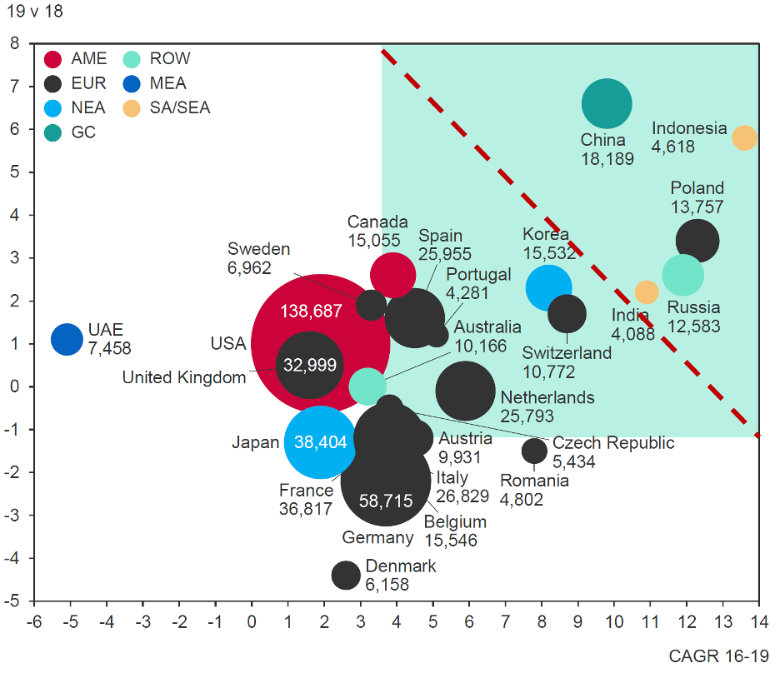
The leading country importer of softlines (apparel, footwear, home textiles, fabric and accessories) remains the USA with over 1/5 of all global imports destined for the USA, however, its relative weight is declining year on year, dropping from over 23% in 2016 to under 22% in 2019.
Germany, Japan, France and the UK round out the top 5, all of which are either dropping relative weight or remaining virtually the same.
The biggest growth importers of softlines in terms of relative weight include the Netherlands, Poland and Switzerland in Europe; China, Korea, Indonesia and India in Asia as well Russia.
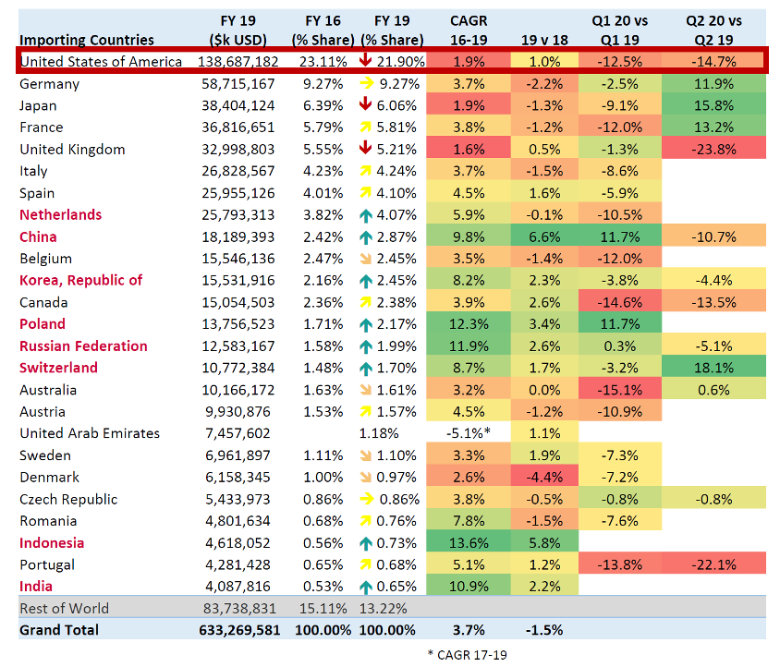
When looking at the bubble chart, the star growth countries can be seen in the upper right quadrant – namely, China, Poland, Indonesia, Russia and India. Korea and Switzerland also deserve a mention in terms of above average growth rates in 19 vs 18 as well 16-19 CAGR.
The biggest exporters of Footwear remains China, although its relative importance has declined from over 34% in 2016 to <29% in 2019.
The next four biggest exporters of footwear to the major trading hubs (USA, Europe, China, Japan, Brazil, Viet Nam, India and Indonesia) include Viet Nam, Italy and Germany, who have all increased their relative share of global footwear imports and Indonesia.
Other growth exporters of footwear include Belgium, the Netherlands, France, Poland and Switzerland for Europe, Cambodia in Asia and the USA.
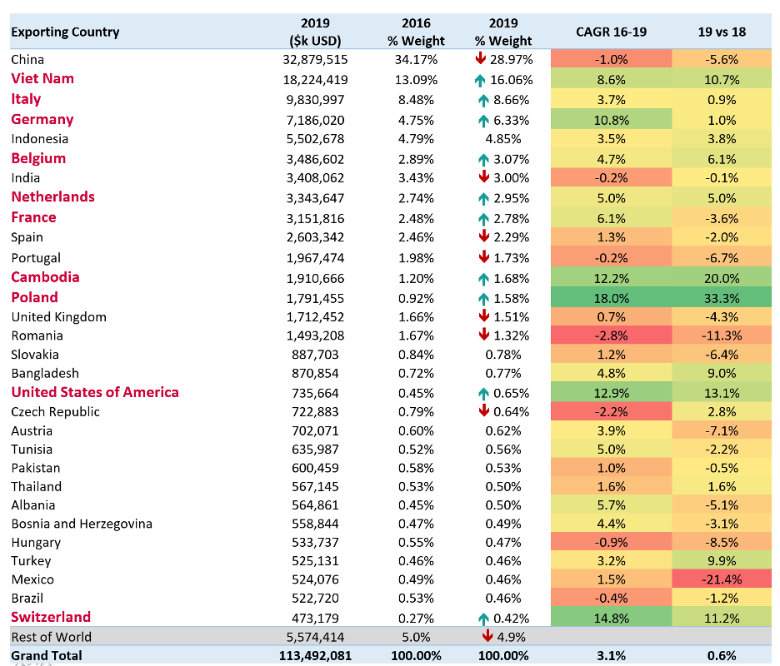
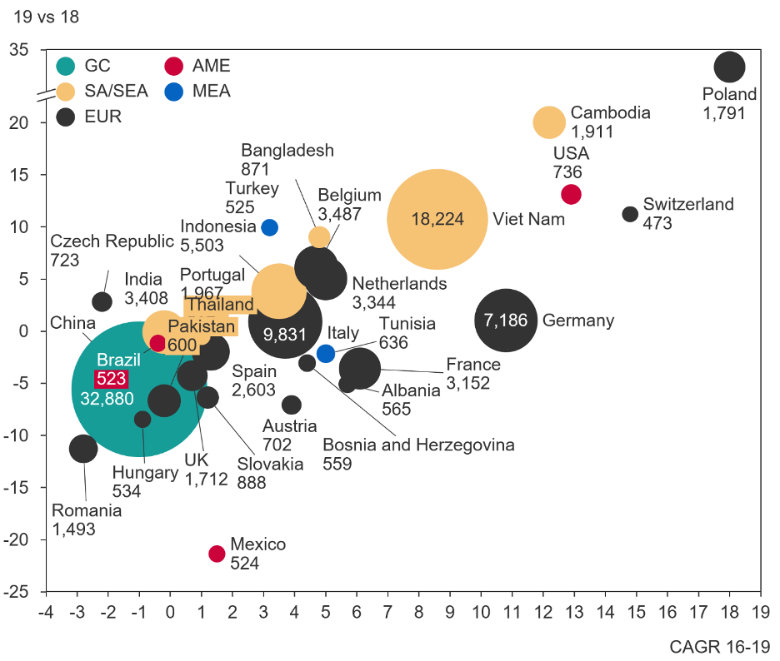
When we turn our attention to the major growth engines, we can clearly see Poland, Cambodia, the USA and Switzerland are the star performers with Viet Nam and Germany as the large exporters who are still performing above average and taking share from China.
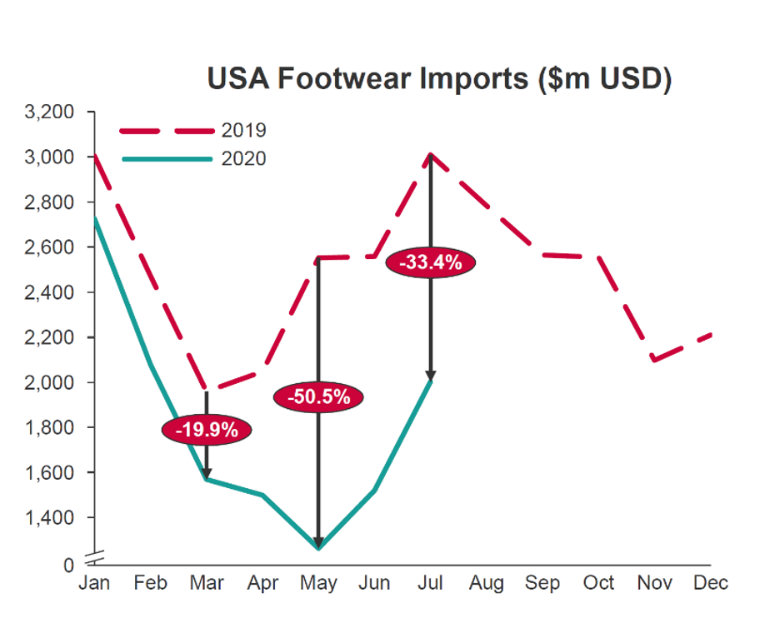
At the height of COVID-19 in the USA, footwear imports were half of what they were in 2019. There is some recovery up to July according to the latest data we have, but there is still a big gap in imports of footwear into the USA between 19 and 20.
Within footwear we have packaged the following HS categories / products:
• 4203 – Articles of apparel and clothing accessories, of leather or of composition leather
• 4205 – Leather or composition leather articles n.e.c. in chapter 42
• 64 – Footwear; gaiters and the like; parts of such articles
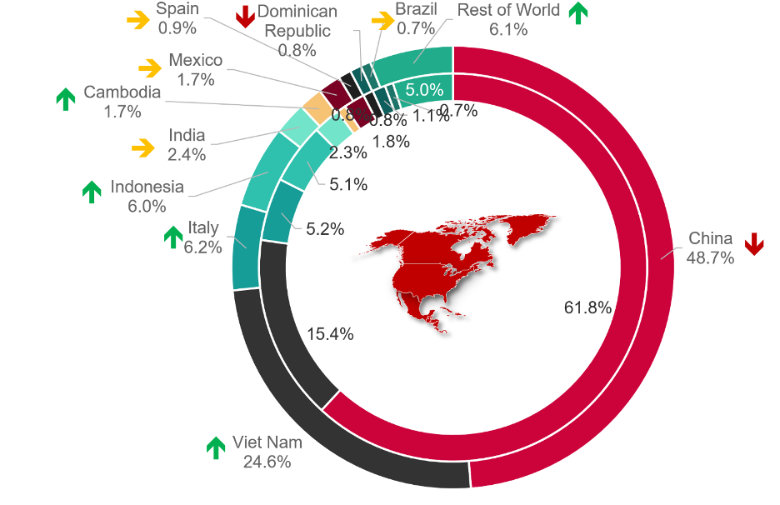
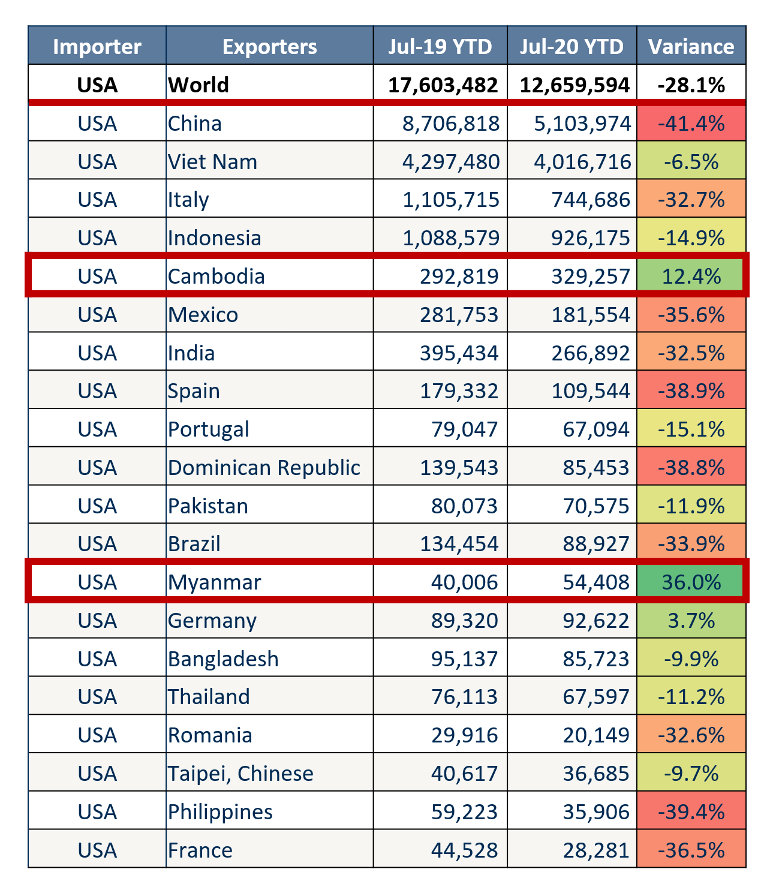
Following China, the top 5 alternative sourcing partners for USA importers of footwear are Viet Nam, Italy, Indonesia, Cambodia and Mexico which accounted for 42.6% with all experiencing growth in share of total USA import.
The major shift is the transfer of China’s drop in weight (-13.1%) to Viet Nam (+9%), Italy (+1%), Indonesia (+1%), India/Cambodia (+1%) and RoW (+1%)
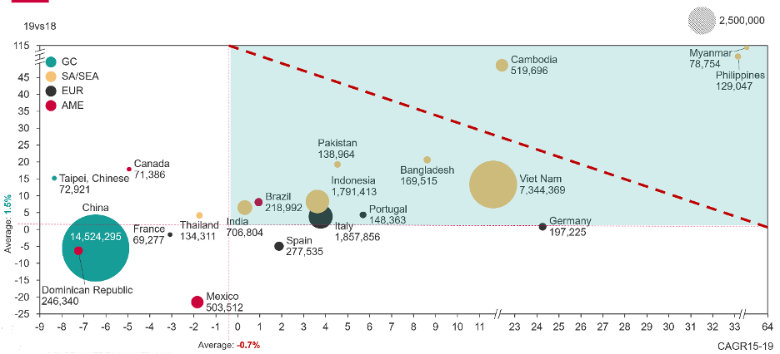
USA experienced a 28% drop in footwear imports Jul-20 YTD vs Jul-19 YTD. Major decline was in China who dropped 41%. Viet Nam and Indonesia both beat the USA average whilst Cambodia and Myanmar demonstrated significant double digit growth in Jul-20 YTD versus last year.
12 are growth engines in this sector with SEA dominating. Myanmar and Philippines are the star growth engines, albeit with a small base in 2019. Viet Nam and Cambodia follow; both with double digit 15-19 and 19 vs 18. Germany also experienced a massive CAGR 15-19 of 24% but was flat 19 vs 18.
4 are losing share, again with China the dominant faller followed by Mexico, Dominican Republic and France.
4 are average to slightly above on one axis – Spain, Thailand, Canada and Taiwan.
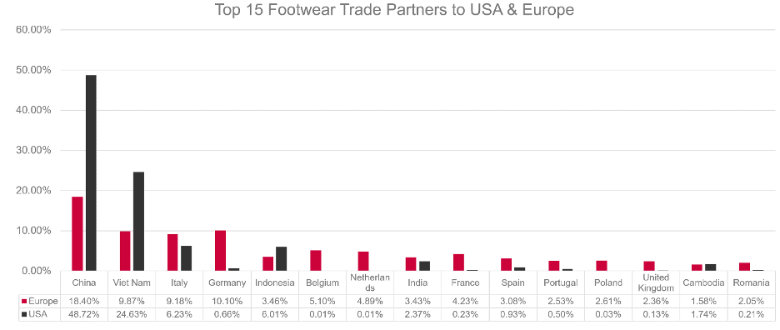
China and Viet Nam account for ¾ of all USA imports providing potential supply chain risk.
Europe on the other hand has under 30% from these two major production hubs, but a lot more intra-region sourcing.
We hope you enjoy our report. Shall you have any questions and please feel free to contact us using the form blow to speak with our representative.