Global Footwear Trade Flow 2020 Report - Europe, China & Japan Markets
Welcome to our Global Footwear Trade Flow 2020 Report (Part 2 of 2) - Last updated in November 2020.
In this report, we will be covering the Europe, China & Japan markets trade flow analysis for the footwear industry. Hope you enjoy our report and please feel free to use the contact us form at the bottom of this page to speak with our representative if you have any questions.
Data Source: Trademap.org
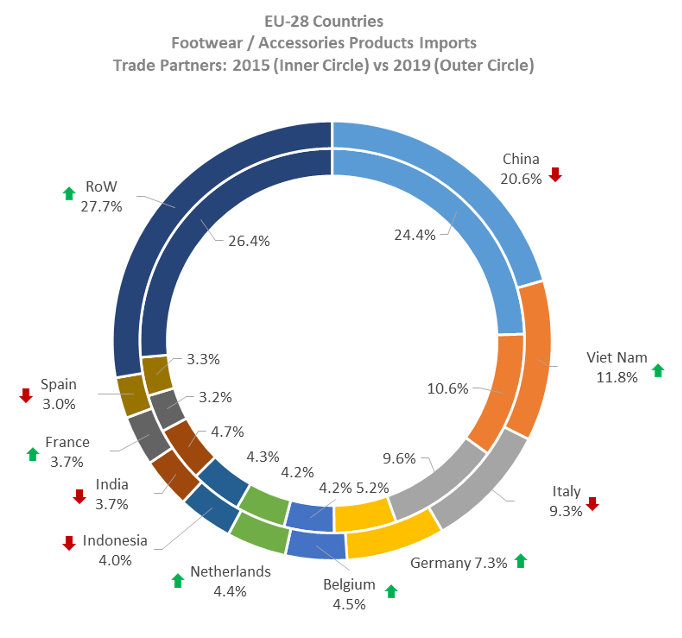
Trade Partners: 2015 (Inner Circle) vs 2019 (Outer Circle) - Europe
1.0
Within footwear we have packaged the following HS categories / products:
• 4203 – Articles of apparel and clothing accessories, of leather or of composition leather
• 4205 – Leather or composition leather articles n.e.c. in chapter 42
• 64 – Footwear; gaiters and the like; parts of such articles
China remained top of the list but its share shrunk to 20.6% in 2019 from 24.4% in 2015. Viet Nam, Italy, Germany, Belgium and the Netherlands are the next top 5 alternative sourcing partners for the region's importers of footwear. The drop in weight of China's share (-3.9%) is mainly taken up by Viet Nam (+1.3%), Germany (+2%), Belgium (+0.3%), and the Netherlands (+0.2%). The shift may widen further as a new trade pact between EU-28 and Viet Nam (effective August 2020) gains traction, and as importers drive an upwards trend towards nearshoring as a risk-based approach to building a more sustainable supply chain.
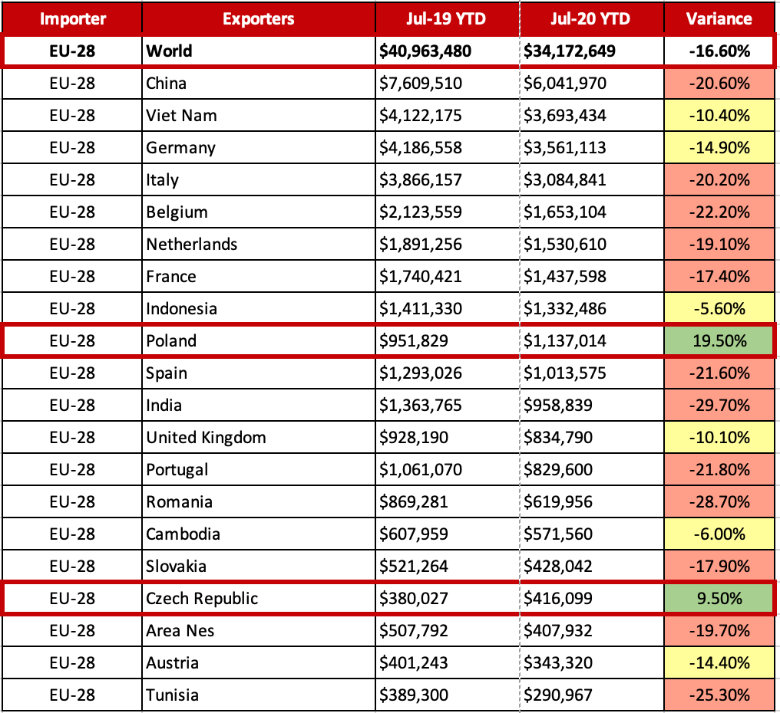
Trade Partners: Jul-19 YTD vs Jul-20 YTD - Europe
2.0
The EU-28 region indicated a 16.6% drop in footwear imports Jul-20 vs Jul-19 YTD.
India dropped almost 30% YoY. China, Italy and Belgium — which are 3 sourcing partners out of the top 5 list — demonstrated a double-digit drop of over 20%. Viet Nam and Germany both hedge the region’s average.
Poland and the Czech Republic each gained a positive growth in Jul-20 YTD YoY.
*Jul-19 YTD & Jul-20 YTD figures below are in USD thousands.
Footwear Trade Growth Engines - Europe
3.0
****** Bubble Chart & Description Goes Here. ******
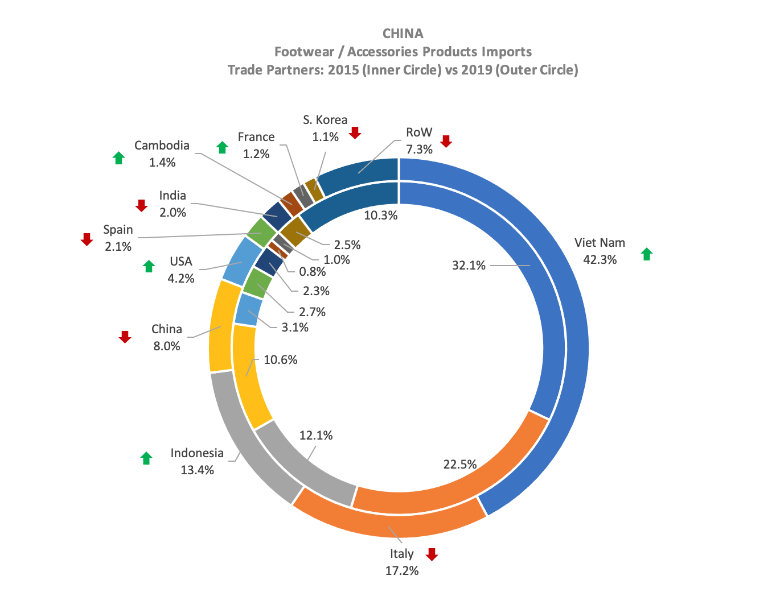
Trade Partners: 2015 (Inner Circle) vs 2019 (Outer Circle) - China
4.0
Viet Nam, as the top sourcing partner for China importers of footwear, accounts for 42.3% of the country's trade share.
China-for-China remained in the Top 5 list but demonstrated a slight 2% drop in share in FY19.
Italy, Indonesia and the USA are the next top offshore sourcing partners, altogether capturing almost 35% of China’s trade share in FY19.
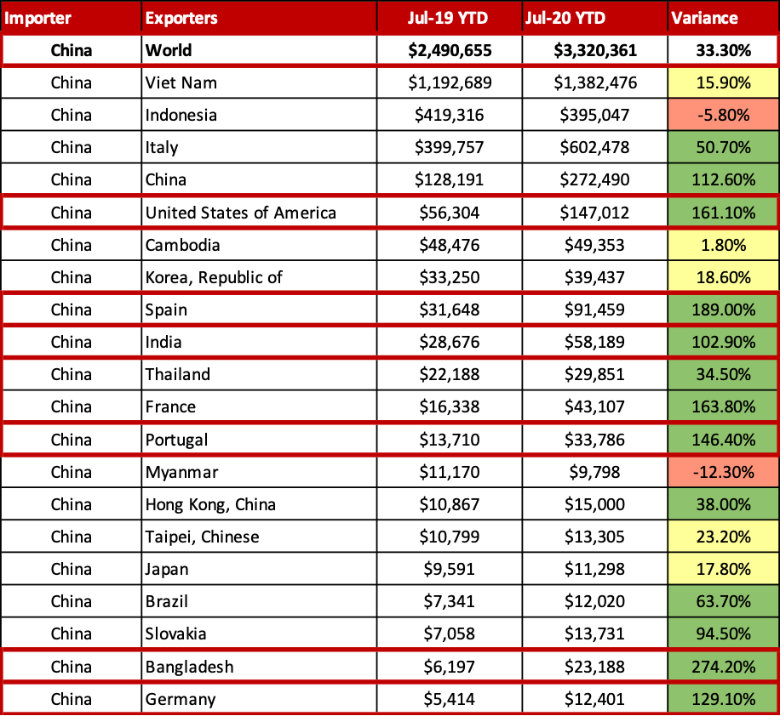
Trade Partners: Jul-19 YTD vs Jul-20 YTD - China
5.0
Viet Nam experienced a 15.9% growth in footwear imports to China Jul-20 YTD vs Jul-19 YTD, which is only a half of the country’s average growth even though Viet Nam is the country’s No. 1 sourcing partner.
Nearshoring sourcing partners, China-for-China, and India each registered strong growth over 100%, while Bangladesh grew over 250% in Jul-20 YTD YoY.
Germany and Portugal demonstrated tremendous growth over 120%; whereas the USA, France, and Spain grew over 160% in Jul-20 YTD YoY.
*Jul-19 YTD & Jul-20 YTD figures below are in USD thousands.
Footwear Trade Growth Engines - China
6.0
****** Bubble Chart & Description Goes Here. ******
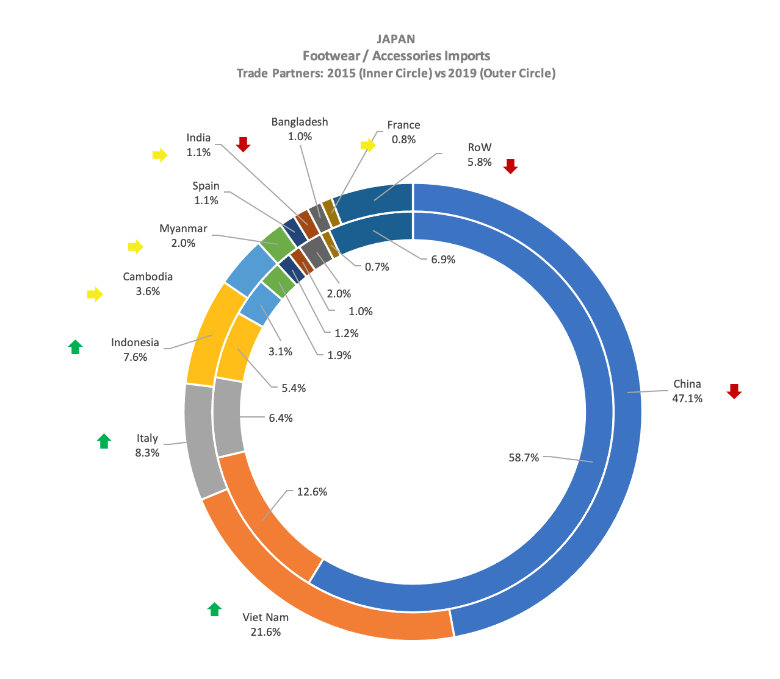
Trade Partners: 2015 (Inner Circle) vs 2019 (Outer Circle) - Japan
7.0
China, the rank-1 sourcing partner for Japan importers of footwear, saw its weighting diminishing to 47.1%, representing a drop of 11.6 percent points in 2015 vs 2019.
Viet Nam, Italy and Indonesia altogether accounted for 37.5% of Japan’s footwear imports. All 3 partners registered positive growth in 2019.
Cambodia, Myanmar and India demonstrated steady trade performance with Japan between 2015 and 2019.
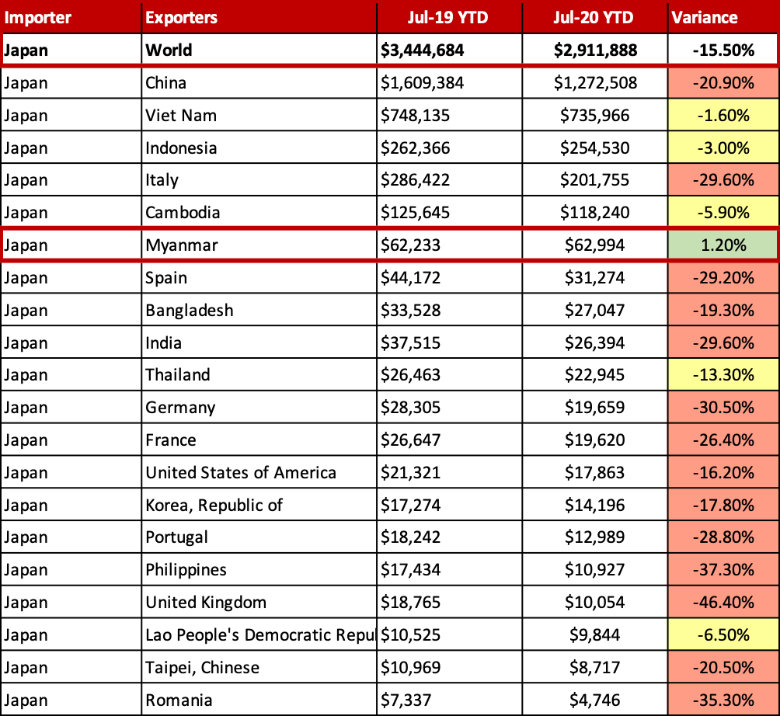
Trade Partners: Jul-19 YTD vs Jul-20 YTD - Japan
8.0
Japan’s trade for footwear imports dropped -15.5% Jul-20 YTD vs Jul-19 YTD. China and Italy, 2 out of the top 5 sourcing partners demonstrated a decrease over -20%, falling beyond Japan’s average YoY.
Viet Nam, Indonesia, and Cambodia also experienced a drop between 1.6% and 5.9%, yet these drops are slim and marginal when compared to Japan’s average.
Myanmar is the only sourcing partner that registered positive growth (+1.2%) in Jul-20 YTD vs Jul-19 YTD.
*Jul-19 YTD & Jul-20 YTD figures below are in USD thousands.
Footwear Trade Growth Engines - Japan
9.0
****** Bubble Chart & Description Goes Here. ******
We hope you enjoy our report. Shall you have any questions and please feel free to contact us using the form blow to speak with our representative.